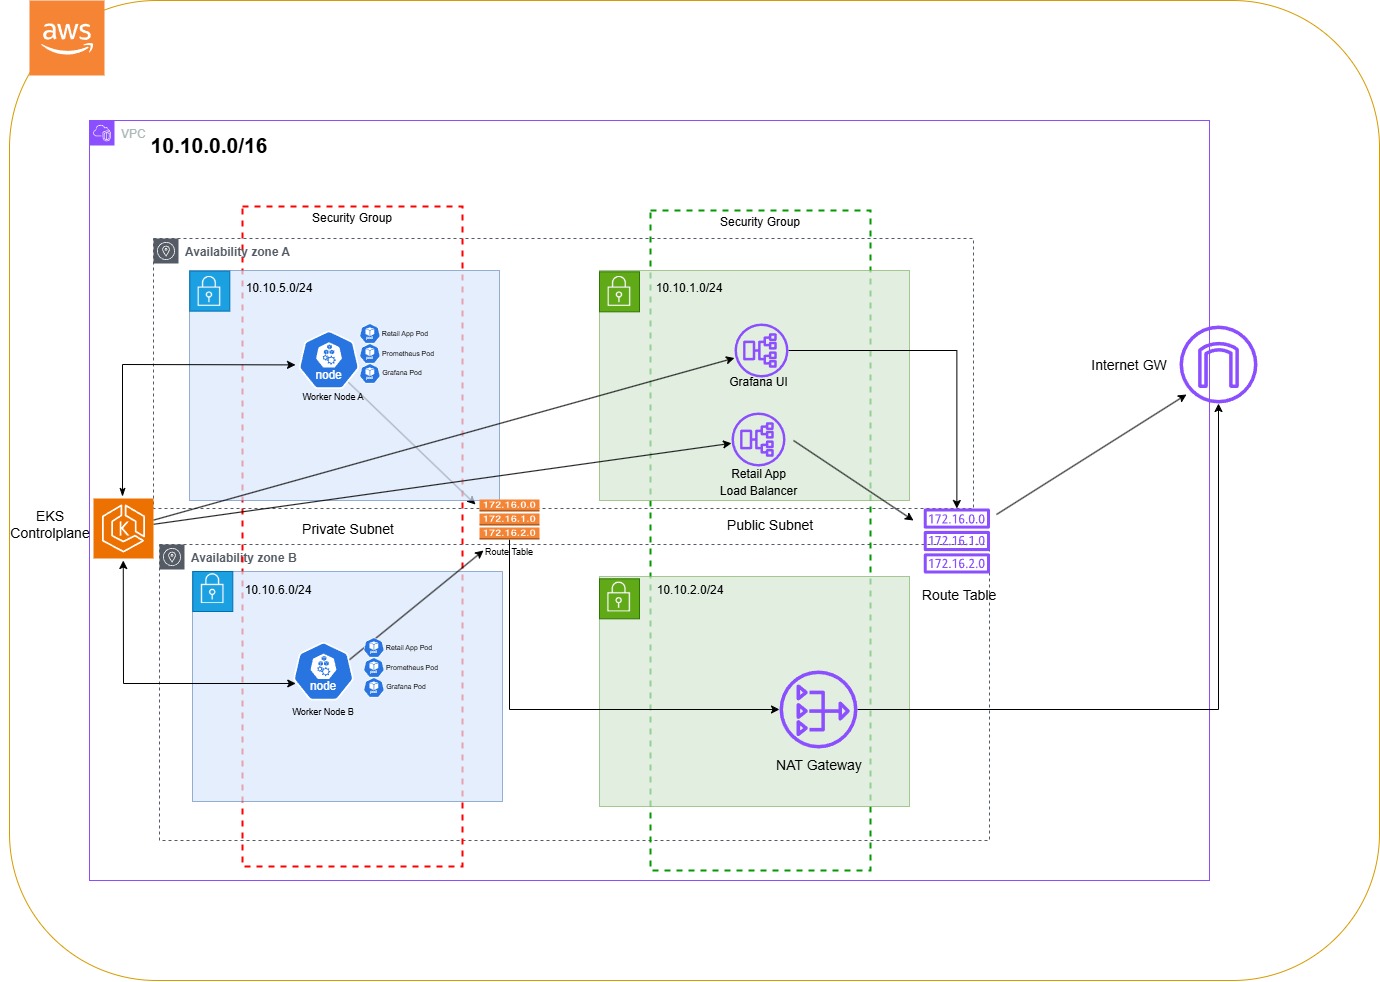
For detailed steps and configurations, follow along with the full video here.
GitHub Repository
https://github.com/0xp4ck3t/eks-retail-app-monitoring
You can download the files and test the setup with the following commands:
git clone https://github.com/0xp4ck3t/eks-retail-app-monitoring.git
cd eks-retail-app-monitoring
terraform init
terraform apply
Use kubectl to run the application:
kubectl apply -f https://raw.githubusercontent.com/aws-containers/retail-store-sample-app/main/dist/kubernetes/deploy.yaml
Get the URL for the frontend load balancer like so:
kubectl get svc ui
To install Prometheus and Grafana via Kubernetes
helm repo add prometheus-community https://prometheus-community.github.io/helm-charts
custom-values.yaml
prometheus:
  service:
    type: LoadBalancer
grafana:
  service:
    type: LoadBalancer
helm upgrade --install kube-prometheus-stack prometheus-community/kube-prometheus-stack -f custom-values.yaml
Prometheus Query: Paste these query into Grafana panels to visualize the metric.
Uptime
time() - process_start_time_seconds{job="catalog"}

Average Request Duration
sum(rate(gin_request_duration_seconds_sum[5m])) / sum(rate(gin_request_duration_seconds_count[5m]))

Total Request
sum(increase(gin_requests_total{job="catalog", url!="/health"}[$__range]))

Request by Status
sum(rate(gin_requests_total{job="catalog"}[15m])) by (code)

Error Rate
sum(increase(gin_requests_total{code=~"404"}[15m])) / sum(increase(gin_requests_total{job="catalog", url!="/health"}[15m]))
Architecture

1. VPC (Virtual Private Cloud)
The VPC is the core networking layer for this infrastructure, configured with the CIDR block 10.10.0.0/16. It provides isolated networking for all resources in the Amazon EKS cluster.
2. Subnets
-
Private Subnets:
10.10.5.0/24(Availability Zone A)10.10.6.0/24(Availability Zone B)
These subnets host the EKS worker nodes. They are not directly accessible from the internet, ensuring secure execution of workloads.
-
Public Subnets:
10.10.1.0/2410.10.2.0/24
Public subnets house the Kubernetes Load Balancer and the NAT Gateway, enabling external access and outbound traffic routing.
3. EKS Control Plane
The EKS Control Plane is fully managed by AWS, handling cluster operations such as API server management, health monitoring, and scheduling.
4. Worker Nodes
- Worker Node A (Private Subnet:
10.10.5.0/24) - Worker Node B (Private Subnet:
10.10.6.0/24)
These nodes are EC2 instances that run the application workloads. They remain secure within private subnets while connecting to external services via the NAT Gateway.
5. Kubernetes Load Balancer
Deployed in the public subnet, the Kubernetes Load Balancer exposes applications running in the EKS cluster to external users. It efficiently distributes incoming traffic to worker nodes.
6. NAT Gateway
The NAT Gateway, located in the public subnet, allows resources in private subnets (like worker nodes) to access the internet for tasks such as pulling container images, while blocking unsolicited inbound traffic.
7. Route Tables
- Private Route Table: Routes traffic from private subnets to the NAT Gateway for outbound internet access.
- Public Route Table: Routes internet-bound traffic from the public subnet to the Internet Gateway.
8. Internet Gateway
The Internet Gateway enables outbound and inbound communication for resources in the public subnet, such as the Load Balancer.
9. Security Groups
Security groups control inbound and outbound traffic across components:
- Public subnet security groups protect the Kubernetes Load Balancer.
- Private subnet security groups secure worker nodes, allowing only necessary communication.
10. Monitoring: Prometheus and Grafana
Prometheus and Grafana are deployed as Kubernetes pods to monitor both cluster and application performance.
-
Prometheus:
- Collects metrics from Kubernetes components, worker nodes, and the sample application.
- Service Type: LoadBalancer (exposes Prometheus for external access).
- Deployed in the public subnet for accessibility.
-
Grafana:
- Provides a UI to visualize metrics collected by Prometheus.
- Service Type: LoadBalancer (accessible via external IP for monitoring dashboards).
- Deployed in the public subnet alongside the Prometheus service.
Architecture Flow
- Admin has access to Grafana UI and Prometheus via the Load Balancers deployed in public subnets.
- Prometheus collects metrics from worker nodes and pods running in private subnets.
- Grafana queries Prometheus for these metrics to provide visualization dashboards.
Traffic Flow
- External traffic enters via the Internet Gateway and is handled by the Kubernetes Load Balancer in the public subnet.
- The Load Balancer routes requests to worker nodes in private subnets.
- Worker nodes use the NAT Gateway to securely access the internet for outbound tasks like pulling updates or images.